Comparison Columns in Tableau — Shift and Overlap Bars with One Easy Calc
Datawrapper recently launched comparison columns natively in their tool. I found this design is not only eye catching, but I also might actually be able to use it effectively at work, so I wanted to learn to build it in Tableau.

When I mentioned this to Nick Pillsbury — he reminded me that he already used this style in his 2023 Iron Viz entry, “Calculating my salary in Skyrim”

Cracking his viz open, we see it only takes one calculation to shift the bars:
if [Table Name] = 'Adventuring' then .101 else .1 end 
There you have it! One easy calc to shift the placement of your bars.
But…I wanted to see if I could more fully replicate the Datawrapper look, and as I mentioned above, I’d like to use this at work. The most common application I’d use this is with time series data, comparing current to previous period across multiple categories. Despite the title of this article, we will need slightly more than one calc, but the effort is still fairly low.
Let’s walk through how to do this with our favorite Tableau data source, Superstore. For this example, we’ll look at the sum of sales split out by different regions, and compare year over year performance.
Setting up the Calcs
First Calculation — figuring out our max sales date:
//Max Sales Date
{MAX([Order Date])}
Second Calculation — split out our periods into current, previous, or other:
//Current or Previous
IF DATETRUNC('month',[Order Date])
  = DATETRUNC('month',[Max Sales Date]) = TRUE
  THEN 'Current'
ELSEIF DATETRUNC('month', [Order Date])
  = DATEADD('year',-1,DATETRUNC('month', [Max Sales Date])) = TRUE
  THEN 'Previous'
ELSE 'Other'
END
Third Calculation — our bar shifter from above
//Bar Shifter
IIF([Current or Previous]='Current',2,1)
Note: you can change the numbers in this calculation to adjust the shift.
Fourth Calculation: our super cool color field. This concatenates our region + period so we can color each combination distinctly.
//Super Cool Color Field
[Region]+[Current or Previous]
Creating the Viz
Now that we have our calcs all set up, let’s make the viz.
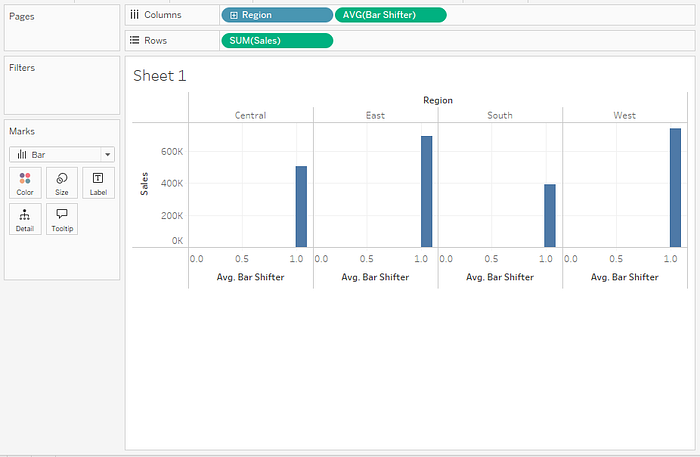
We’ll start with Region on columns, and sum(sales) on rows

Let’s add avg(bar shifter) to the Columns, and change mark type to Bar
Now let’s add the year of our order date to detail
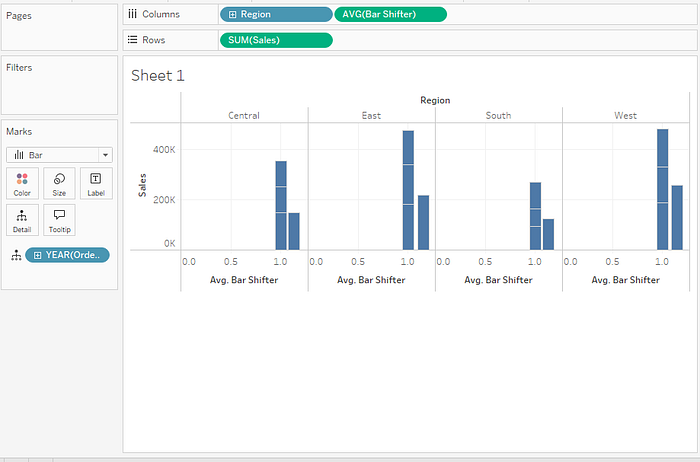
You can see now at this point, there are four segments, because we have 4 years of data in this dataset — our current, previous, and two ‘other’. Let’s get this down to just current and previous by adding our “Current or Previous” field to the filters, and excluding “other”
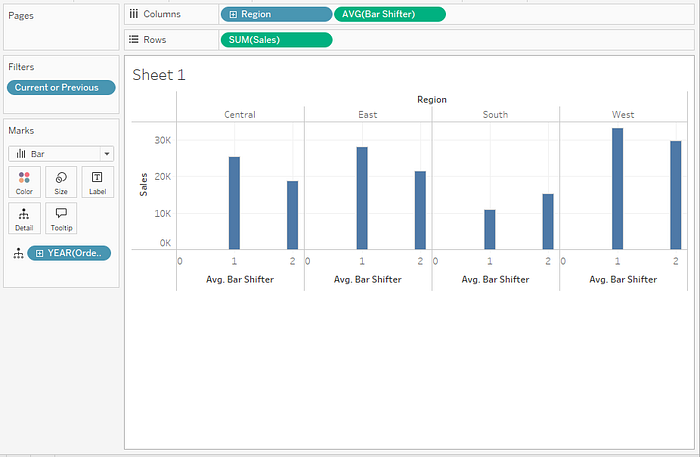
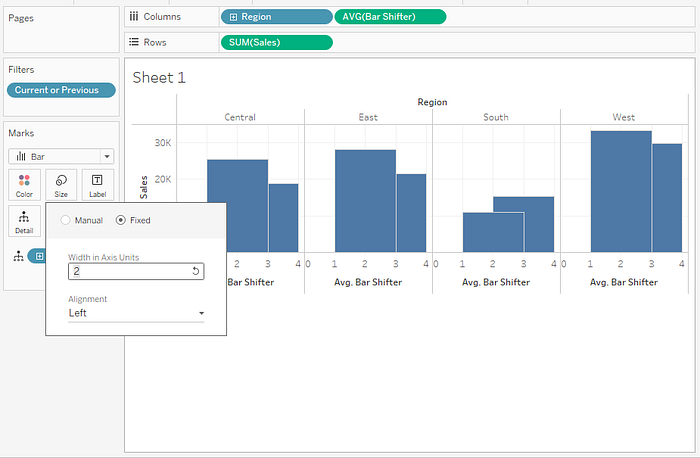
Now you can see that we have two bars — but they’re pretty far apart. Time to play with size settings to get the look we want.
I’m going to toggle “Size” from manual to fixed as shown, and put in a width of 2. I’ll also edit my axis to be fixed going from 0 to 5 to get the spacing I want.
Next, let’s add our super cool color field and see how it looks.
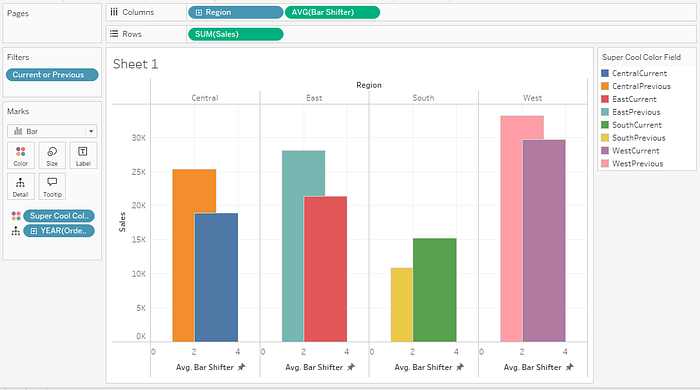
At this point, you’ll need to manually pick your colors, so that your “current” period is bolder, and “previous” is lighter. Tableau has several default palettes that are easy to apply a dark/light look, including Tableau 20, Summer, Winter, Green-Orange-Teal, Blue-Red-Brown, and Pink-Purple-Gray. Here’s what it looks like with the Summer palette applied:
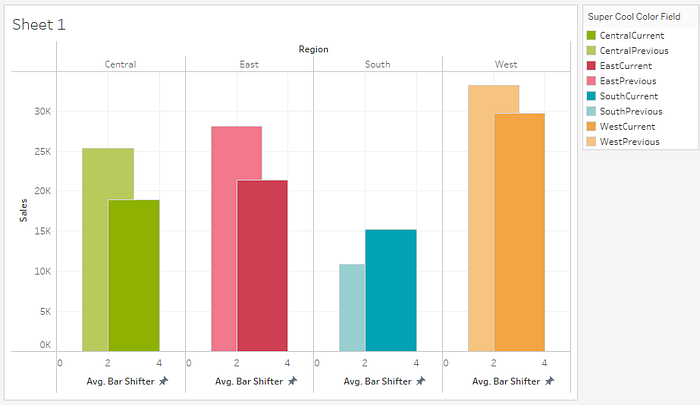
There you have it — shifted bars!
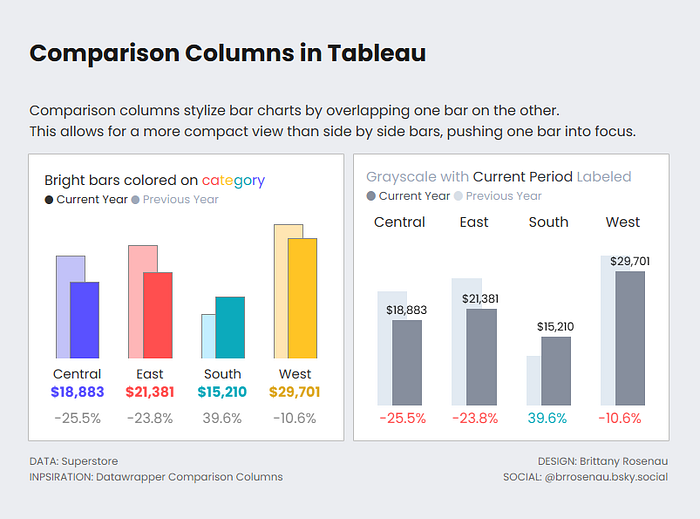
From this point on, it’s a matter of fussing with formatting to get to your desired end state. I’ve put together two versions of this that I could see used in a business setting, either on a slide deck or in a KPI card as part of a larger board. It’s published to Tableau Public — feel free to crack it open to see how I did the rest / reverse engineer for yourself.
Further Reading and Resources:
- Calculating my salary in Skyrim | Nick Pillsbury
- How to overlay bar charts | Tableau Forums
- How to build an overlapping Bar Chart in Tableau | Jeffrey Shaffer (I found this perusing Tableau Public after I completed my charts. I like that Jeffrey’s version also includes a shape indicator as well)
- Comparison Columns | Datawrapper
- Big Aggregated Number Generator | LaDataViz (this tool is incredibly useful for automatically creating common date calculations comparing current and previous periods. The demo version using Superstore is free, you can get a license to apply your own data)
- Colors — Palettes and Generators — my personal collection of 56 bookmarks (and counting!) related to generating colors for data viz.
Bonus: Tableau Conference!
I’ll be in sunny San Diego for Tableau Conference April 15–17. If you’ll be there as well, please say hi if you see me! I won’t be presenting, but I’ll be attending sessions, cheering at Iron Viz, and hanging out in the Data Village. I’ll also be running (ba dum tss) the 4th annual Tableau Conference Step Tracker — and this year I’m bringing stickers. If you’d like to learn more about how to participate (in person or virtually) + give me feedback for this initiative, check out the blog post below. Hope to see you there!