Coming Soon: The TC25 Step Tracker!

It’s coming back…the Tableau Conference Step Tracker!
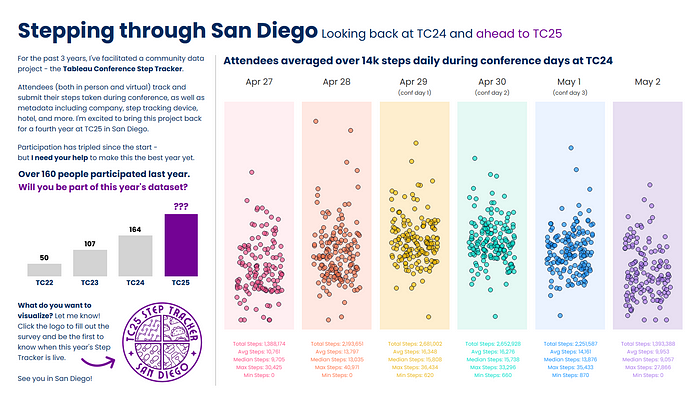
For the fourth year, I’ll be facilitating a survey to collect data for steps taken during conference, as well as metadata including favorite step tracking device, hotels, social media handles, and more. This year I’m trying something new — an interest + feedback form.
What’s in it for you? By filling out the form, you’ll be able to give me feedback on current and future available fields in the step tracker. I’ll use this data to make the Step Tracker better, and set goals for this year.
In return you get my thanks, and reminders when the Step Tracker goes live so you can enter your step data.
Let me know what you think and sign up here:
TC25 Step Tracker Interest + Feedback Form
FAQ:
What am I signing up for?
In return for your feedback, I’ll send you 3 emails:
- An email when the TC25 Step Tracker is live
- An email post-conference with a link to the tracker to fill in your steps
- A ‘last call’ email prior to the tracker closing
After that, I’ll keep a count of how many responses I get in the form for my own data tracking, but I’ll delete the email addresses. You won’t be signing up for any ongoing list, and your email won’t be shared with anyone!
Will you include [dimension, measure] in this year’s tracker?
Maybe — I want to keep a balance between collecting enough fields to facilitate great vizzes, while keeping the survey short and easy to complete.
By filling out the feedback form, you’ll help me gauge interest in what data folks want to visualize, and what fields are worth keeping.
What were last year’s results?
Last year we had 164 participants, logging over 18 million steps. For more detail, check out Michelle Frayman’s excellent recap viz below:

You can also access the data for past conferences for free at data.world:
- https://data.world/brosenau/tc22-las-vegas-step-counts
- https://data.world/brosenau/tc23-step-counts
- https://data.world/brosenau/tc24-step-counts
Can I participate if I‘m not attending Tableau Conference?
Absolutely! Your feedback is welcome whether you will be attending conference in person or watching from home.
Once the Step Tracker is live, both in person and virtual attendees will be able to log steps, and everyone can visualize the data afterwards.
Before you go…
A big thank you to all who have supported me and participated in this project the last three years. I literally could not do it without the community — there wouldn’t be any data!
I’d like to make this the biggest year yet (goal TBD!), so sharing this post or the survey with your friends, colleagues, rivals, is much appreciated.
And of course, I couldn’t not viz about it — check it out on Tableau Public:

Special thanks to Allison Wright, Christina Gorga, DataKo, Felicia Styer, Emily De Padua, and Michelle Frayman for logo, viz, and blog feedback.

