PinnedBrittany RosenauVisualize Tableau Conference — Tracking Steps at #Data24Welcome to the third annual Tableau Conference Step Tracker!4 min read·Apr 25, 2024----
PinnedBrittany RosenauCreate a dashboard overlay — ENTIRELY in TableauNo Figma? No problem. Build an overlay using native features — no powerpoint, images, or advanced techniques needed.6 min read·Aug 2, 2023--3--3
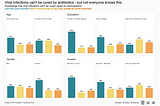
Brittany RosenauMakeover Monday 2024 Week 14 — Public Awareness Around Antibiotic ResistanceThis week’s Makeover is my Day 3 of the 30 Day Chart Challenge.3 min read·Apr 3, 2024----
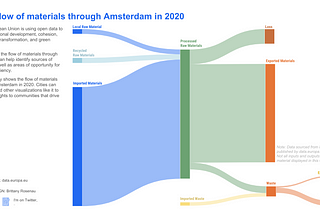
Brittany RosenauMakeover Monday 2024 Week 13—The Life of Raw Materials in Amsterdam WalkthroughMakeover Monday is a weekly project where participants improve how they visualize and analyze data — one chart at a time.3 min read·Mar 26, 2024----
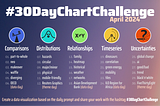
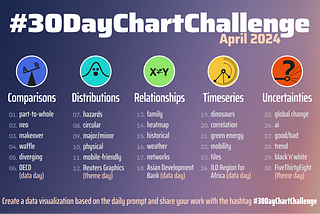
Brittany RosenauI’m trying the 30 Day Chart Challenge — Here’s what I hope to get out of itOr — how I plan to crank out more vizzes in a month that I usually publish publicly in a year.3 min read·Mar 25, 2024--1--1
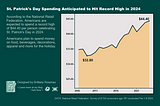
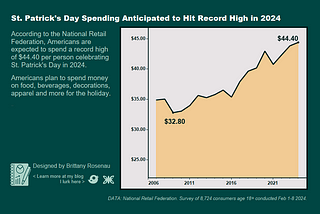
Brittany RosenauMakeover Monday 2024 Week 12 — St. Patrick’s Day Spending WalkthroughSee how I rework this week’s line chart2 min read·Mar 19, 2024----
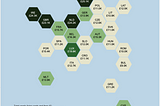
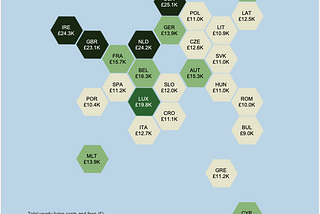
Brittany RosenauMakeover Monday 2024 Week 4 — Cost of Studying in EuropeStep by Step creating a hex map heat map of Europe in Tableau3 min read·Jan 30, 2024----
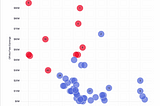
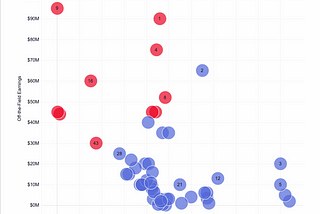
Brittany RosenauMakeover Monday 2024 Week 4 - Highest Paid Athletes WalkthroughMakeover Monday is a weekly project where participants improve how they visualize and analyze data — one chart at a time.2 min read·Jan 23, 2024----
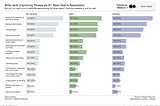
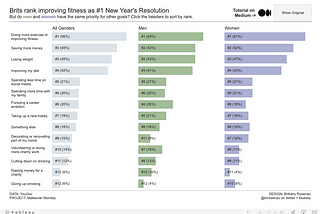
Brittany RosenauMakeover Monday 2024 Week 1— New Year’s Resolutions WalkthroughI walk through my process for making over a bar chart using rankings5 min read·Jan 18, 2024--2--2
Brittany Rosenau5 Tiny Tips to get the most out of Tableau PublicIt’s a new year — and that means at time of writing I’ve seen plenty of chatter about data viz resolutions. Whether your goal is to get…6 min read·Jan 16, 2024----