PinnedBrittany RosenauVisualize Tableau Conference: Results of the #Data24 Step Tracker SurveyThe data is in — time to viz! Get the free data set.May 21May 21
PinnedBrittany RosenauCreate a dashboard overlay — ENTIRELY in TableauNo Figma? No problem. Build an overlay using native features — no powerpoint, images, or advanced techniques needed.Aug 2, 20235Aug 2, 20235
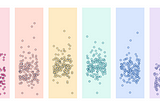
Brittany RosenauMakeover Monday 2024 Week 34 Walkthrough—How to Make a Trellis ChartLearn how to make a trellis chart without continous fieldsAug 20Aug 20
Brittany RosenauMakeover Monday 2024 Week 30 — Streaming Hits 40% of U.S. TV Usageaka how to improve a pie and stacked bar chartsJul 25Jul 25
Brittany Rosenau5 Quick Questions about Tableau Ambassador Nominations2 weeks left-who will you nominate as next year’s leaders?Jun 26Jun 26
Brittany Rosenau5 Tiny Ideas to improve Tableau PublicVote on feature requests that make your day to day work in Tableau Public betterJun 13Jun 13
Brittany RosenauVisualize Tableau Conference — Tracking Steps at #Data24Welcome to the third annual Tableau Conference Step Tracker!Apr 25Apr 25
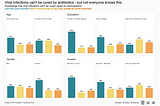
Brittany RosenauMakeover Monday 2024 Week 14 — Public Awareness Around Antibiotic ResistanceThis week’s Makeover is my Day 3 of the 30 Day Chart Challenge.Apr 3Apr 3
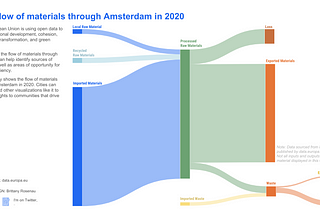
Brittany RosenauMakeover Monday 2024 Week 13—The Life of Raw Materials in Amsterdam WalkthroughMakeover Monday is a weekly project where participants improve how they visualize and analyze data — one chart at a time.Mar 26Mar 26